
Monitoring and data collection with Logstash, Graphite, Grafana and Statsd
We have already setup our centralized log collection system based on Logstash as described in this article Centralized logs collection with Logstash. It’s been working great so far and the Kibana front-end provides nice insight into the collected data. However, sometimes we might want some bigger flexibility in displaying and analyzing the data and that’s where Graphite comes in place.
Introduction to Graphite
In whole is basically a collection of a few components that allow for the aggregation, storage and querying of metrics from many hosts. Graphite itself does not provide agents for collecting data on monitored hosts, default dashboards or alerting functionality. Consider it a “metrics core” on which a full monitoring / alerting system can be built by adding additional layers.
The core components:
- Carbon
- An event-driven, Python-based
Twisteddaemon that listens on a TCP port, expecting a stream of time-series data. - Time-series data in concept:
someMetric:someValue:timeStamp Carbonexpects time-series data in a particular format (of two primary types - line and pickle). Third party tools that support Graphite are used to feed properly formatted data, such as Collectd or StatsD.- Metrics can be anything from OS memory usage to event counts fired off from an application (e.g. number of times a function was called).
- After Carbon receives metrics, it periodically flushes them to a storage database.
- An event-driven, Python-based
- Whisper
- A lightweight, flat-file database format for storing time-series data (similar to
RRD). - It does not run as a stand-alone service or bind to a port. Carbon natively supports writing to disk in
Whisperformat. -
Each unique metric type is stored in a fixed-size file. If you fed in the metrics memory free and memory used for both Host A and Host B, the following database files would be created:
$WHISPER_DIR/carbon/whisper/HostA/memory-free.wsp $WHISPER_DIR/carbon/whisper/HostA/memory-used.wsp $WHISPER_DIR/carbon/whisper/HostB/memory-free.wsp $WHISPER_DIR/carbon/whisper/HostB/memory-used.wsp - The size of database files is determined by the number of data points stored - this is configurable (details later).
- A lightweight, flat-file database format for storing time-series data (similar to
- Graphite Web
- A
Djangoweb UI that can query Carbon daemons and read Whisper data to return complete metrics data, such as all memory used values logged for Host A over the last 6 hours. - Graphite Web can be used directly for composing basic graphs.
- Graphite Web provides the
REST APIthat can be queried by third-party tools (such as Grafana) to create complete dashboards. - The API can return either raw text data or a rendered graph (
.pngformat).
- A
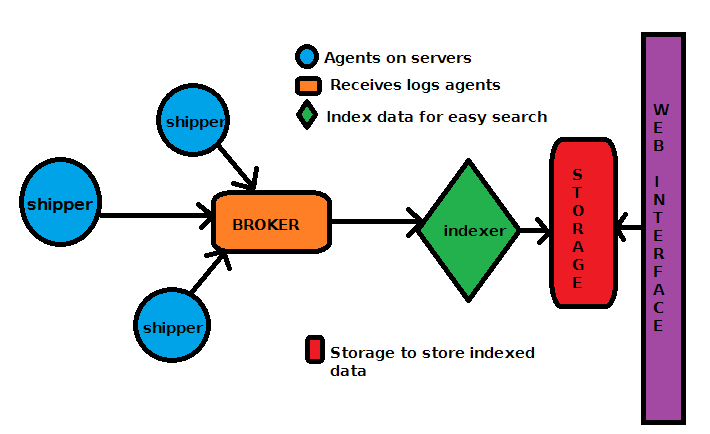
The complete system architecture including statsd feeding data from arbitrary sources is shown on the picture below.

Picture1: Graphite architecture
Installation and setup
Graphite
The easiest way to install the Graphite components is using python-pip. But first install some dependencies:
user@server:~$ sudo aptitude install libpq-dev pkg-config
user@server:~$ sudo aptitude install python-dev python-pip python-cairo python-psycopg2 libcairo2 libcairo2-dev
user@server:~$ sudo aptitude install python-django python-django-tagging
user@server:~$ sudo memcached python-cairo-dev python-ldap python-memcache
user@server:~$ sudo aptitude install postgresql postgresql-client
and then the graphite binaries:
user@server:~$ sudo pip install graphite-web carbon whisper
The daemons have problems with python Twisted latest version 14.0 that gets installed so we need to downgrade that to 13.1:
user@server:~$ sudo pip install twisted==13.1
The Graphite components get installed under /op/graphite. In this way we can easily upgrade the packages later by:
user@server:~$ sudo pip install --upgrade graphite-web carbon whisper
After completing the installation we can check if all dependencies are met:
user@server:/opt/graphite$ sudo ./check-dependencies.py
All optional dependencies are met.
All necessary dependencies are met.
The latest source bundles are available at:
https://github.com/graphite-project/graphite-web/archive/0.9.12.tar.gz
https://github.com/graphite-project/carbon/archive/0.9.12.tar.gz
https://github.com/graphite-project/whisper/archive/0.9.12.tar.gz
so if we want to go down that route instead installing via pip, we can download the tarballs, extract and run inside the root of each of the directories created:
sudo python setup.py install
This will also install all of the components under /opt/graphite.
Carbon setup
First we need to create the Carbon config and storage files from the examples supplied in the source:
user@server:/opt/graphite/conf$ sudo cp carbon.conf.example carbon.conf
user@server:/opt/graphite/conf$ sudo cp storage-schemas.conf.example storage-schemas.conf
user@server:/opt/graphite/conf$ sudo cp storage-aggregation.conf.example storage-aggregation.conf
The most important part of the Carbon config file is the caching:
[cache]
LINE_RECEIVER_INTERFACE = 0.0.0.0
LINE_RECEIVER_PORT = 2003
PICKLE_RECEIVER_INTERFACE = 0.0.0.0
PICKLE_RECEIVER_PORT = 2004
CACHE_QUERY_INTERFACE = 0.0.0.0
CACHE_QUERY_PORT = 7002
Carbon accepts metrics in two different formats, that’s what’s going on here:
- Metrics in line format should be received on port 2003
- Metrics in pickle format should be received on port 2004
The difference is that line format is a plaintext protocol with one metric name, value and timestamp per datum. The pickle format allows for metrics to be sent in batches and is used where heavy amounts of metrics are being transferred.
If we’re using a tool like Statsd or Collectd to feed metrics from some host, it’s sending in line format and should be transmitting to the Graphite box on port 2003. The pickle format is used when a Carbon-Relay daemon is load-balancing/proxying metrics data to multiple Carbon-Cache daemons in a Graphite cluster.
We can simply start the daemon by running:
user@server:/opt/graphite/conf$ sudo python /opt/graphite/bin/carbon-cache.py start
Starting carbon-cache (instance a)
As we said before we can start multiple instances on the same server listening on different ports by pointing to different config files on start-up.
Whisper config
As mentioned before, Carbon-Cache stores the data received in Whisper database files under /opt/graphite/storage/whisper that have .wsp file extension. How Whisper stores and aggregate data is specified in the /opt/graphite/conf/storage-schemas.conf file. For example we can add:
...
[stats]
priority = 110
pattern = ^stats\..*
retentions = 10s:6h,1m:7d,10m:1y
...
for our data feed into Carbon by Statsd, letting Whisper know that we want to store high resolution metrics at every 10 seconds for 6 hours, at 1 minute for 7 days and lower resolution metrics at every 10 minutes for 1 year.
Graphite Web setup
Carbon-Cache and Whisper are on the side of writing data. Graphite Web is how data is queried. Basically, it’s a Django app that can read metric data from one of three sources:
- Directly from Whisper database files on-disk
- From Carbon-Cache daemons on their CACHE_QUERY_PORT (set in the carbon config file)
- From other instances of Graphite Web through the REST API
Once data is fetched by Graphite Web, it delivers it in two fashions:
- Makes it directly accessible in your web browser by simply visiting the Graphite Web app address, and allows you to construct your own graphs or dashboards
- As raw data or rendered png graphs emitted through a REST API
The reason one Graphite Web instance can demand data through the API of another instance is fundamental to how Graphite clustering works, in respect to querying data from many nodes. Secondly, the API from the Web app is consumed by third-party dashboards so even if we are not going to use Graphites provided graphing capabilities, we can consider Graphite Web as API endpoint. The reason Graphite web can query data from either a Carbon-Cache instance through the CACHE_QUERY_PORT or directly from on-disk Whisper database files is another great piece of functionality: metrics don’t have to be flushed to disk before they are available for querying. As soon as a metric is received by a Carbon-Cache daemon, it’s immediately accessible. Graphite Web both read on-disk data and query the in-memory data in all listed Carbon-Cache daemons, combine and deliver.
By default Graphite Web stores its data in SQLight database. For purpose of production, we will set PostgreSQL database and Graphite user:
user@server:~$ sudo service postgresql start
 * Starting PostgreSQL 9.1 database server                                      [ OK ]

user@server:~$ sudo -u postgres createuser graphite
Shall the new role be a superuser? (y/n) n
Shall the new role be allowed to create databases? (y/n) y
Shall the new role be allowed to create more new roles? (y/n) n

user@server:~$ sudo -u postgres createdb -O graphite graphite
user@server:~$ sudo -u postgres psql -d template1
psql (9.1.11)
Type "help" for help.
template1=# ALTER USER graphite WITH PASSWORD '<my-password>';
ALTER ROLE
template1=# ALTER USER postgres WITH PASSWORD '<my-password>';
ALTER ROLE
template1-# \q
user@server:~$
Now we can configure the Django settings where we have to specify two things: a basic storage back-end (database engine) for saving users and dashboards created directly in the app, and a Carbon-Cache instance CARBONLINK_HOSTS that it will query for data. And it’s all defined in the local_settings.py config file:
...
# General settings
TIME_ZONE = 'Australia/Sydney'
SECRET_KEY = '<my-password>'
ALLOWED_HOSTS = '127.0.0.1'
DEBUG = True
#MEMCACHE_HOSTS = ['10.10.10.10:11211', '10.10.10.11:11211', '10.10.10.12:11211']
MEMCACHE_HOSTS = ['127.0.0.1:11211']
DEFAULT_CACHE_DURATION = 60 # Cache images and data for 1 minute
# Email settings
EMAIL_BACKEND = 'django.core.mail.backends.smtp.EmailBackend'
EMAIL_HOST = 'smtp.mydomain.com'
EMAIL_PORT = 587
EMAIL_HOST_USER = 'user@mydomain.com'
EMAIL_HOST_PASSWORD = '<my-password>'
EMAIL_USE_TLS = True
# Database settings
DATABASES = {
    'default': {
        'NAME': 'graphite',
        'ENGINE': 'django.db.backends.postgresql_psycopg2',
        'USER': 'graphite',
        'PASSWORD': '<my-password>',
        'HOST': 'localhost',
        'PORT': '5432'
    }
}
...
We also set the local server time zone, our SMTP server details and Memcached details that Graphite Web will use for memory caching (Memcached starts with 64MB of memory by default). The rest of the config, like Whisper and Carbon settings, can be left as they are by default.
Now we have to create the Graphite Web database tables:
user@server:/opt/graphite$ PYTHONPATH=`pwd`/webapp:`pwd`/whisper sudo python ./webapp/graphite/manage.py syncdb
Creating tables ...
Creating table account_profile
Creating table account_variable
Creating table account_view
Creating table account_window
Creating table account_mygraph
Creating table dashboard_dashboard_owners
Creating table dashboard_dashboard
Creating table events_event
Creating table auth_permission
Creating table auth_group_permissions
Creating table auth_group
Creating table auth_user_groups
Creating table auth_user_user_permissions
Creating table auth_user
Creating table django_session
Creating table django_admin_log
Creating table django_content_type
Creating table tagging_tag
Creating table tagging_taggeditem
You just installed Django's auth system, which means you don't have any superusers defined.
Would you like to create one now? (yes/no): yes
Username (leave blank to use 'root'):
Email address: igorc@encompasscorporation.com
Password:
Password (again):
Superuser created successfully.
Installing custom SQL ...
Installing indexes ...
Installed 0 object(s) from 0 fixture(s)
user@server:/opt/graphite$
The super user we just created in the process will be used to login to Django if we want to save the dashboards we create. After that we are ready to start the daemon:
user@server:~$ sudo python /opt/graphite/bin/run-graphite-devel-server.py --port 8080 /opt/graphite/ &
The problem here is that the Graphite Web interface is not secured and completely open for anyone to access it. That’s why I have setup a Nginx vhost to be reverse proxy to Graphite Web and had is secured via LDAP and SSL.
The REST API
Graphite comes with powerful REST API available under /render url that can be used for fetching and graphing metrics. Examples:
# single server load on large graph
http://graphite/render?target=server.web1.load&height=800&width=600

# average load across web machines over last 12 hours
http://graphite/render?target=averageSeries(server.web*.load)&from=-12hours

# number of registered users over past day as raw json data
http://graphite/render?target=app.numUsers&format=json

# rate of new signups per minute
http://graphite/render?target=summarize(derivative(app.numUsers),"1min")&title=New_Users_Per_Minute
More details at http://graphite.readthedocs.org/en/latest/render_api.html
Testing
For testing purposes I have used a script to run in a infinite loop generating random numbers between 1 and 6 (like dice roll) and feeding the data into Carbon-Cache, thus simulating metrics data source:
while true; do echo "local.random.diceroll $((RANDOM%6+1)) `date +%s`" | nc -q0 127.0.0.1 2003; sleep 60; done &
and this is the graph I was able to produce:

Picture2: Graphite graph
Auto start the Graphite daemons
For this purpose I have installed Supervisord package:
user@server:~$ sudo aptitude install supervisor
and created the following config file so it can take control over the daemons:
[program:carbon-cache]
command=python /opt/graphite/bin/carbon-cache.py --debug start
process_name=%(program_name)s
autostart=true
autorestart=true
stopsignal=QUIT
#stdout_logfile=/var/log/carbon-cache/stdout.log
#stderr_logfile=/var/log/carbon-cache/stderr.log

[program:statsd]
command=/usr/bin/node /opt/statsd/stats.js /opt/statsd/localConfig.js
process_name=%(program_name)s
autostart=true
autorestart=true
stopsignal=QUIT
user=www-data
stdout_logfile=/var/log/statsd.log
stdout_logfile_maxbytes=10MB
stdout_logfile_backups=3
stderr_logfile=/var/log/statsd.log

[program:graphite]
command=python /opt/graphite/bin/run-graphite-devel-server.py --port 8080 /opt/graphite/
process_name=%(program_name)s
autostart=true
autorestart=true
stopsignal=QUIT
stdout_logfile=/var/log/graphite/graphite_out.log
stdout_logfile_maxbytes=10MB
stdout_logfile_backups=3
stderr_logfile=/var/log/graphite/graphite_error.log
stderr_logfile_maxbytes=10MB
stderr_logfile_backups=3
Known issues
When I tried to login with the Django admin account created above I got the following error:
IntegrityError at /composer/
duplicate key value violates unique constraint "account_profile_user_id_key"
DETAIL: Key (user_id)=(1) already exists.
Request Method: GET
Request URL: http://server.mydomain.com/composer/
Django Version: 1.6.2
Exception Type: IntegrityError
Exception Value:
duplicate key value violates unique constraint "account_profile_user_id_key"
DETAIL: Key (user_id)=(1) already exists.
The problem is that Django didn’t create the sequence keys properly when transitioned from SQL to PostgreSQL database. The fix is to set the sequence properly for the table and key it complained about:
user@server:~$ sudo su - postgres
postgres@kibana:~$ psql -d graphite

graphite-# \di account_profile_user_id_key
                             List of relations
 Schema |            Name             | Type  |  Owner   |      Table
--------+-----------------------------+-------+----------+-----------------
 public | account_profile_user_id_key | index | graphite | account_profile

graphite=# SELECT setval('account_profile_user_id_key', (SELECT MAX(id) FROM account_profile)+1)
graphite=# \q

user@server:~$
so basically we are increasing the sequence number by 1.
Statsd and Logstash Shipper
We can install Statsd from source via deb packages:
root@server:~# cd /tmp/
root@server:~# git clone https://github.com/etsy/statsd.git
root@server:~# cd statsd/
root@server:~# dpkg-buildpackage
root@server:~# dpkg -i /tmp/statsd_0.6.0-1_all.deb
Then we have to configure it and point it to our Carbon-Cashe service:
root@server:~# mv /etc/statsd/localConfig.js /etc/statsd/localConfig.js.default
root@server:~# vi /etc/statsd/localConfig.js
{
	graphitePort: 2003,
	graphiteHost: "127.0.0.1",
	address: "0.0.0.0",
	port: 8125,
	debug: "true",
	flushInterval: 10000,
	dumpMessages: true,
	log: "/var/log/statsd.log",
	graphite: {
		legacyNamespace: false
	}
}
and we start the service:
root@server:~# service statsd start
Now that we have Statsd connected to Graphite we can start feeding it with data. For now I’m collecting some stats from the production HAproxy load balancer logs, stats that we don’t have any details abou and that I think might come useful for troubleshooting and monitoring, like how much time serving a web page from our application servers takes and what kind and how many different HTTP response codes we get. After adding the Statsd output type to HAproxy Logstash Shipper script we can start sending data to Statsd which in turn will aggregate and send it to Carbon-Cache (Graphite collector).
input {
   file {
      type => "haproxy"
      path => ["/var/log/haproxy/haproxy.log"]
      exclude => ["*.gz"]
      sincedb_path => "/opt/logstash/logstash-hap.db"
   }
}
filter {
   if [type] == "haproxy" {
     grok {
       match => {"message" => ["%{HAPROXYHTTP}"]}
       add_tag => ["MYTAG"]
     }
   }
}
output {
   stdout { }
   redis {
      host => "127.0.0.1"
      data_type => "list"
      key => "logstash"
      password => "<redis-password>"
   }
   statsd {
      type => "haproxy"
      host => "server.mydomain.com"
      port => 8125
      namespace => "logstash"
      debug => true

      # Request response time
      timing => [ "%{server_name}.servetime", "%{time_request}" ]

      # Total serve time
      timing => [ "%{server_name}.totaltime", "%{time_duration}" ]

      # Count one hit every event by response
      increment => "%{server_name}.response.%{http_status_code}"

      # Use the 'bytes' field from the haproxy log as the count value.
      count => [ "%{server_name}.bytes", "%{bytes_read}" ]
   }
}
Next step is to specify the storage schema for the data sent by Statsd (the order is important since Carbon will read this file and pick up the first matched section for the data):
...
[carbon]
pattern = ^carbon\.
retentions = 60:90d

[stats]
priority = 110
pattern = ^stats\..*
retentions = 10s:6h,1m:7d,10m:1y

[default_1min_for_1day]
pattern = .*
retentions = 60s:1d
and the aggregation strategy for the data that Statsd is sending to Carbon-Cache by editing the aggregation file:
...
[min]
pattern = \.min$
xFilesFactor = 0.1
aggregationMethod = min

[max]
pattern = \.max$
xFilesFactor = 0.1
aggregationMethod = max

#[sum]
[count]
pattern = \.count$
xFilesFactor = 0
aggregationMethod = sum

[lower]
pattern = \.lower(_\d+)?$
xFilesFactor = 0.1
aggregationMethod = min

[upper]
pattern = \.upper(_\d+)?$
xFilesFactor = 0.1
aggregationMethod = max

[sum]
pattern = \.sum$
xFilesFactor = 0
aggregationMethod = sum

[gauges]
pattern = ^.*\.gauges\..*
xFilesFactor = 0
aggregationMethod = last

[default_average]
pattern = .*
xFilesFactor = 0.5
aggregationMethod = average
The Carbon-Cache daemon reads this file every 60 seconds but still it is not a bad idea to restart the daemon any way.
And we don’t forget to open the firewall on the Server for Statsd UDP port 8125. Add this at the end of our /usr/local/bin/dshield_firewall.sh firewall script:
...
echo "Allow Statsd UDP port traffic"
$IPT -A INPUT -p udp --sport 1024:65535 --dport 8125 -m state --state NEW -j ACCEPT
and rerun it to open the port.
Grafana
We mentioned in the overview that there are some tools, actually many of them, that we can use for improved Graphite front end. One of them is Grafana. It has beautiful and extremely flexible Dash board and can use ElasticSearch for storing its data, which is very convenient since we already have it running on the server as indexing engine for Logstash. Now the installation:
root@server:~# wget http://grafanarel.s3.amazonaws.com/grafana-1.7.0.tar.gz
root@server:~# tar -xzvf grafana-1.7.0.tar.gz
root@server:~# mv grafana-1.7.0 /var/www/grafana
root@server:~# cp /var/www/grafana/config.sample.js /var/www/grafana/config.js
In the config file we un-comment the section with Graphite and ElasticSearch (Grafana can use different combinations of backends):
...
    // Graphite & Elasticsearch example setup
    datasources: {
      graphite: {
        type: 'graphite',
        url: "https://server.mydomain.com/_graphite",
        default: true,
      },
      elasticsearch: {
        type: 'elasticsearch',
        url: "//"+window.location.hostname+"/es",
        index: 'grafana-dash',
        grafanaDB: true,
      }
    },
...
I will setup a Nginx reverse proxy to Graphite (Carbon-Cache) and ElasticSearch that are running on the same box. It will have SSL encryption and It will authenticate the users against our LDAP servers.
...
    ##
    # LDAP
    ##
    auth_ldap_cache_enabled on;
    auth_ldap_cache_expiration_time 10000;
    auth_ldap_cache_size 1000;
    ldap_server ldap1 {
        url ldap://ldap1.mydomain.com:389/ou=Users,dc=mydomain,dc=com?uid?sub;
        binddn "cn=<bind-user>,ou=Users,dc=mydomain,dc=com";
        binddn_passwd <bind-user-password>;
        group_attribute memberUid;
        group_attribute_is_dn off;
        require group "cn=<my-group>,ou=Groups,dc=mydomain,dc=com";
        require valid_user;
    }
    ldap_server ldap2 {
        url ldap://ldap2.mydomain.com:389/ou=Users,dc=mydomain,dc=com?uid?sub;
        binddn "cn=<bind-user>,ou=Users,dc=mydomain,dc=com";
        binddn_passwd <bind-user-password>;
        group_attribute memberUid;
        group_attribute_is_dn off;
        require group "cn=<my-group>,ou=Groups,dc=mydomain,dc=com";
        require valid_user;
    }
...
we have enabled CORS for the Nginx host as well as recommended on the Grafana web site:
...
    # CORS
    if ($http_origin ~* (https?://[^/]*\.mydomain\.com(:[0-9]+)?)) {  #Test if request is from allowed domain, you can use multiple if
        set $cors "true";                                               #statements to allow multiple domains, simply setting $cors to true in each one.
    }
    location / {
        include  /etc/nginx/mysite.rules;
        #try_files $uri $uri/ /index.html;
        try_files $uri $uri/ =404;
        auth_ldap "Encompass Graphite access";
        auth_ldap_servers ldap1;
        auth_ldap_servers ldap2;
    }
    location ~ ^/_graphite {
        if ($cors = 'true') {
          add_header  Access-Control-Allow-Origin $http_origin;           #this mirrors back whatever domain the request came from as authorized, as
          add_header  "Access-Control-Allow-Credentials" "true";          #as long as it matches one of your if statements
          add_header  "Access-Control-Allow-Methods" "GET, POST, OPTIONS";
          add_header  "Access-Control-Allow-Headers" "Authorization,origin,accept,DNT,X-Mx-ReqToken,Keep-Alive,User-Agent,X-Requested-With,If-Modified-Since,Cache-Control,Content-Type";
        }
        rewrite /_graphite/(.*) /$1 break;
        proxy_pass http://127.0.2.1:8080;
        proxy_redirect off;
        proxy_set_header Host $host;
        proxy_set_header X-Forwarded-For $proxy_add_x_forwarded_for;
        proxy_set_header Authorization "";
    }
    location ~ ^/es {
        rewrite /es/(.*) /$1 break;
        proxy_pass http://127.0.0.1:9200;
        proxy_redirect off;
        proxy_set_header Host $host;
        proxy_set_header X-Forwarded-For $proxy_add_x_forwarded_for;
        proxy_set_header Authorization "";
    }
...
After restarting Nginx then the Grafana UI will be awailable at https://server.mydomain.com.
Conclusion
With this combination of open source tools like Logstash, Graphite and Statsd we can easily collect and monitor any set or arbitrary data. It can also easily scale up to monitor hundreds if not thousands of servers,as reported by some users, via resource clustering and careful data space planing. Grafana adds that extra flexibility to create literally any kind of graphs and present them by filtering the data through various functions available in the tool.
Leave a Comment